Decent Sampler is slightly more than just a sample player. There are hidden depths if you go looking, and regular readers will know that I love deep products! So here are some hints, tips and ideas for getting the most out of the Translation Tables!
Translation Tables
Yes, I know, they aren't exactly going to be headline news, but there'a a lot that you can do with them.
The Power_Curve Spreadsheet
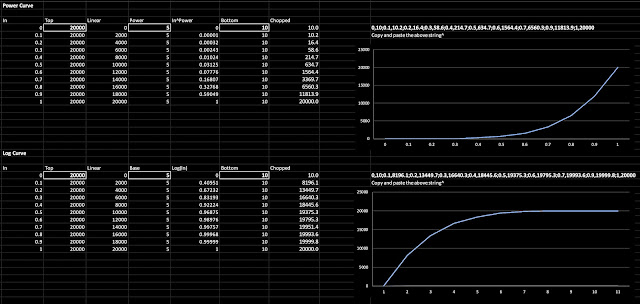
First off, I'm going to mention my newly updated spreadsheet (.xlsx and .ods versions are available) for creating exponential / power law curves instead of the default linear mapping that Decent Sampler uses:
The default settings are aimed at one of the first things that you will probably want to 'fix' with a translation table: the mapping between the control (slider, rotary...) and the values! At the low end, the control of cut-off frequency for the low-pass filter is a little bit abrupt - you can suddenly get loud sounds when you were not expecting them, especially when the Q control is set high. So the default curve takes about half of the travel of the control (slider, rotary) to get from 10 Hertz to 635 Hertz, which is a lot of low-end precision. The other half then goes from 635 Hz to 22kHz, which feels okay to my fingers.
The spreadsheet doesn't have any instructions, so here's a quick explanation of one way of working with it.
 |
| The Power_curve spreadsheet |
Start by setting the limits.
Set 'Top' to the highest value you want to control - for the low-pass filter this will be 22kHz, so put '22000' into the 'Top' box.
Then set 'Bottom' to the lowest value you want to control - for the low-pass filter this is 20Hz, so put '20' into the 'Bottom' box.
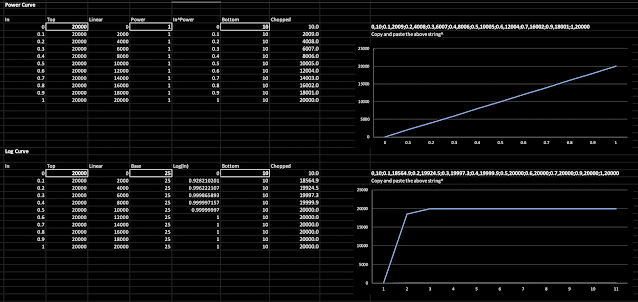
You now need to choose the 'Power/Base' setting - putting '1' into the 'Power/Base' box will give a straight line, which is the default in Decent Sampler. Putting higher values into the 'Power/Base' box will make the curve more and more 'boomerang shaped (the bend in the curve will get more and more extreme!). The default value of '5' may be too much for you - I actually think that '3' is a good starting point for you to find what suits your fingers and your UI (rotary and slider controls feel different with different 'Power/Base' settings...).
Note that a Power curve puts more detail at the lower end of the control's range, whilst a Log curve puts more detail at the higher end.
 |
| The extreme values of 'Power/Base'... |
Here are the limits to the curves: Power/Base set to 1 gives a straight line, whilst 25 gives a very abrupt corner! You can really see the piecewise linear approximations (straight lines) for the log curve.
Once you have a curve that seems right, just copy and paste the long string of numbers above the graph and paste it into the translation table definition:
translationTable="0,10;0.1,10.2;0.2,16.4;0.3,58.6;0.4,214.7;0.5,634.7;
0.6,1564.4;0.7,6560.3;0.9,11813.9;1,20000"
Here's an example 'binding' that you might use inside a <control> element:
<binding
type="effect"
level="instrument"
position="0"
parameter="FX_FILTER_FREQUENCY"
translation="table"
translationTable="0,10;0.1,10.2;0.2,16.4;0.3,58.6;0.4,214.7;0.5,634.7;
0.6,1564.4;0.7,6560.3;0.9,11813.9;1,20000"
/>
Controlling Volume
Changing the 'feel' of rotary or slider controls isn't the only thing you can use Translation Tables for... Because you can put more than one <binding> element inside a <control> element, then you can make controls that do more than one thing at once!
One typical use would be to mix between two different sounds - you could have a sustained sample and a percussive sample, and you want to be able to give the user a continuous control of the mix between the two samples. Now you could use two separate controls to do this, but a single mix control is much neater, and if you make it a horizontal slider, then you could do a DJ Controller background...
The simplest way of doing a mix control would be to have two opposite tables, as shown above.
The 'Second Volume Curve' is a straight line, but think of it as a curve that is straight rather than curvy... and it looks just like the linear table shown above. You can specify a table like this with just two points: one at the beginning and one at the end. This 'curve' starts out at zero (silence) and goes up to 1 (full volume) as the input controller moves from 0 to 127 (on a MIDI Mod Wheel, but it could also be 1 for a rotary or slider control...or any other value you define in the table...).
In the diagrams, I have shown a Mod Wheel as the controller, so the minimum and maximum values are 0 and 127, but in the text I have used 0 and 1 as the controller values, because this is a more generic example.
The 'First Volume Curve' is another straight line, but going the opposite way. So the volume starts out at maximum and ends up at silence as the input controller moves from 0 to 1 (or 127, or...). So one volume does the opposite of the other. In Decent Sampler, this is just two <binding> elements inside a <control>:
<control x="195" y="30" parameterName="Mix" type="float"
minValue="0.001" maxValue="1.0" value="0.8"
trackForegroundColor="FFFF7700" trackBackgroundColor="FF000000"
width="30" height="180" style="linear_vertical" >
<binding type="amp" level="tag" identifier="0" parameter="TAG_VOLUME"
translation="table" translationTable="0,1;0.5,0;1,0" />
<binding type="amp" level="tag" identifier="1" parameter="TAG_VOLUME"
translation="table" translationTable="0,0;0.5,1;1,0" />
</control>
In this example, the two 'TAG-VOLUME's will affect the volume of the '0' and the '1' tagged groups in the Decent Sampler XML file... But you could also use tags and AMP_VOLUME if you prefer:
<binding type="amp" level="group" position="0" parameter="AMP_VOLUME" ...table1... />
<binding type="amp" level="group" position="1" parameter="AMP_VOLUME" ...table2... />
The two important bits here are the two Translation Tables:
translationTable="0,1;0.5,0.5;1,0"
translationTable="0,0;0.5,0.5;1,1"
The top table starts at 1 and drops to 0, whilst the bottom table starts at 0 and rises to 1. The middle position is 0.5, and this is where things get a little bit tricky. As you move the input control, the 'volume' that you hear might not stay constant, and it might sound like it gets quieter, or louder, in the middle. It depends on how the volume is controlled (linear, logarithmic or other), and sometimes even the samples themselves - in the example I mentioned at the beginning, then the percussive sample is probably going to sound quieter than the sustained sample, and so even if the volume that you might see in a DAW or audio editor says that they have the same peak volume, when you mix between them it could sound strange. But this is why you have detailed control over the translation tables!
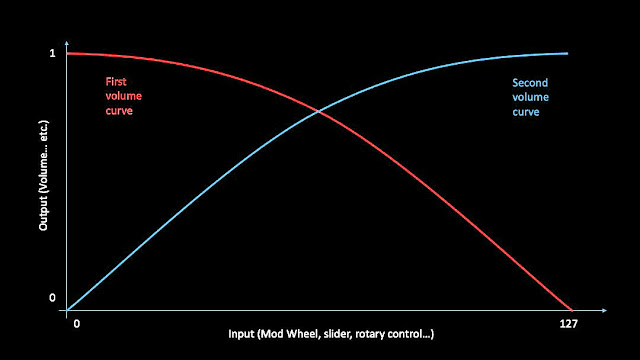
The general case is probably going to be that you will need two curves instead of straight lines, perhaps something like the ones shown above. The easiest way to do this is to use those straight line approximations again:
translationTable="0,1;0.5,0.66;1,0"
translationTable="0,0;0.5,0.66;1,1"
So now the half-way setting of the input is going to output 2/3rds of the percussive and the sustained samples, instead of half volume. As I said, the exact value will depend on the samples and your preferences - Virtual Instruments are very context-sensitive!
The 'Arbitrary_curve' spreadsheet is another utility that helps to design volume curves...
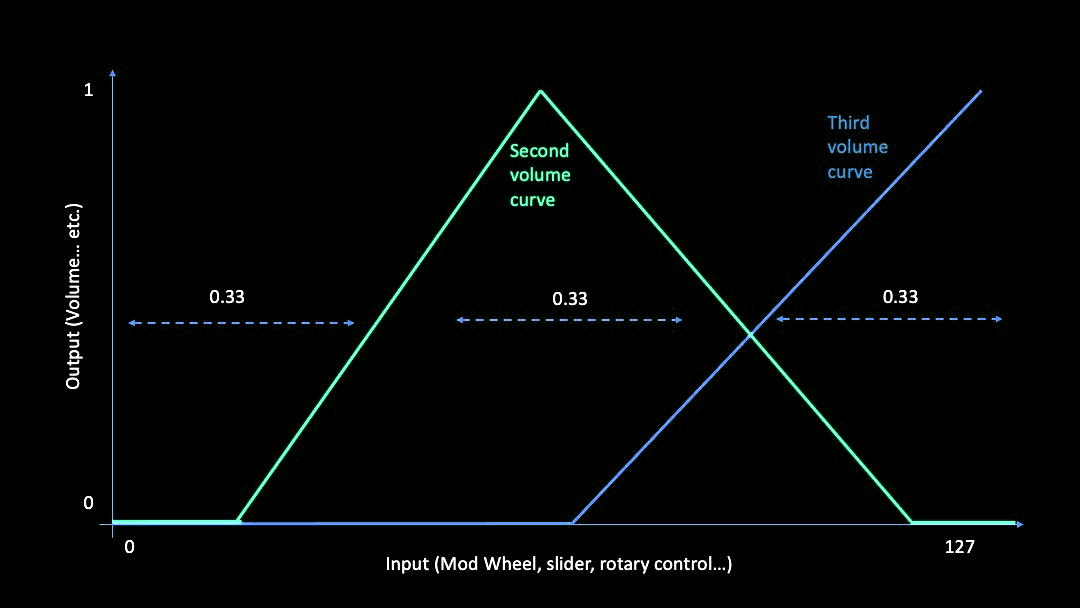
You may have realised that there's a potential problem with the mix control - it always makes a sound! What might be lots more useful (and interesting) would be a mix control that starts out at zero volume, then raises the volume of the sustained sample, and then mixes in the percussive sample whilst dropping the sustained sample, so half way would be a mix of the two sounds, and ending up with just the percussive sample at the end of the mix control's movement. This time, the curves are very different in the zero position (and I have deliberately renamed them to second and third):
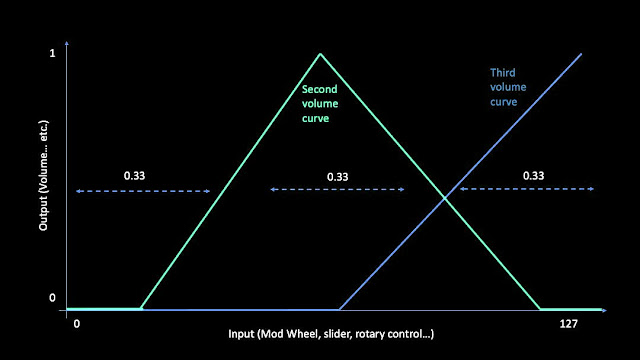
At the zero position, the volume for both samples needs to be zero. As the input value rises, the sustained sample gets louder and louder, and at half way it is at full volume. Notice that the percussive (third volume curve) doesn't start until slightly later, so that there is a 'dead zone' around the half-way point where you hear just the sustained sample. From half way to just below the maximum input control position, the sustained sample fades out as the percussive sample fade up. There is another 'dead zone' at maximum input where just the percussive sample is heard.
<binding ... translationTable="0,1;0.2,0.5;1.0;0,0.66,0.5;0.95,0;1,0" />
<binding ... translationTable="0,0;0.55,0;0.66,0.5;1,1" />
And the curvy version is shown above - just more pairs of values in the translation table.
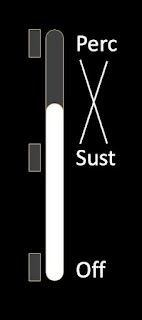
The UI might look something like the above draft graphics... And here is exactly this type of sustain-percussive slider in use:
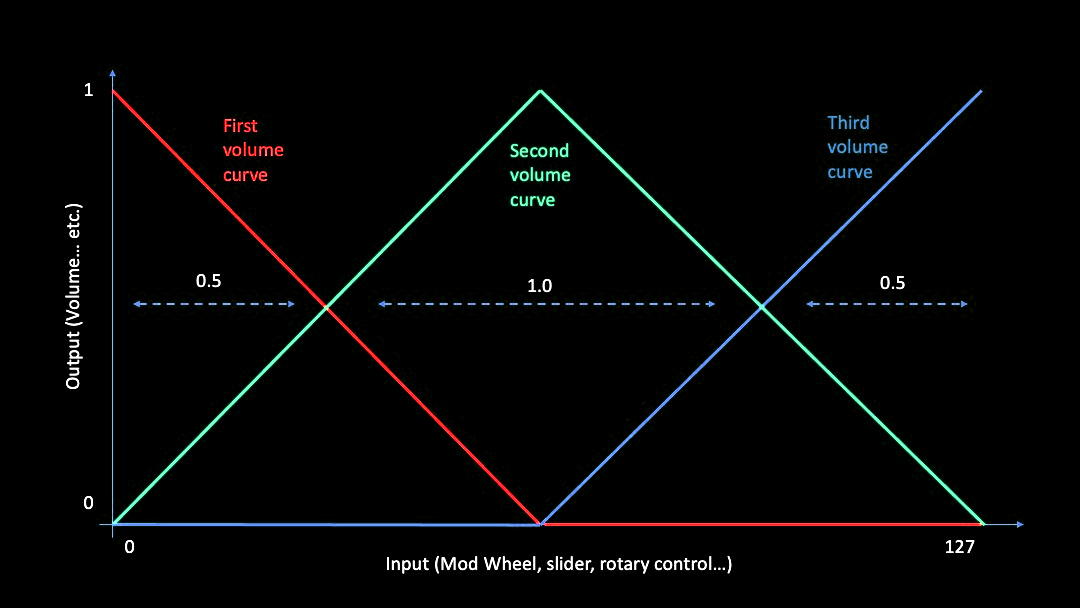
Now it may have occurred to you that the UI graphics above are actually a three-way mixer, except one of the positions is zero volume (and no sample). If we replace the zero volume with a third sample then we have a single rotary or slider control that fades between three different samples:
A simple form is shown above. I've not put in the dead zones that would probably be useful in a real implementation, because I wanted to show the basic form of a three-way volume control on a single rotary or slider control. This time there are three tables:
translationTable="0,1;0.25,0.5;0.5;0,0.75,0.0;1,0"
translationTable="0,0;0.25,0.5;0.5,1;0.75,0.5;1,0"
translationTable="0,0;0.25,0.0;0.5,0;0.75,0.5;1,1"
Turning this into the 'curvy' form reveals something that wasn't as significant in the sustain/percussive mixer - the middle section is too big: it is twice as big as the sections either side of it (0.5, 1.0, 0.5 in the diagram above - and yes, I know it should have been 0.25, 0.5, 0.25, but this seems to obscure things rather than making them clearer!)
translationTable="0,1;0.33,0.66;0.5;0,0.66,0.0 ;1,0"
translationTable="0,0;0.33,0.66;0.5,1;0.66,0.66;1,0"
translationTable="0,0;0.0 ,0.0 ;0.5,0;0.66,0.66;1,1"
So, using 0.33 and 0.66 as the two places where the mixing is 0.5, gives us a different curvy form. The rotary or slider control is now split into 3 zones: one for each sample. Note that this is not a full 3-way mixer: it only fades between sample 1 and 2, or 2 and 3. It isn't possible to fade between 1 and 3, because there isn't anywhere on the control that goes there!
(I leave it as an exercise to see if you can figure out a way to provide a fade between 1 and 3... It isn't pretty, but it is possible...)
This means that the samples need to be carefully chosen, so that the user never wants to use the missing fade! One possible approach might be to have the Sustain sample in the middle (2), the Percussive sample at the top (3), and some sort of Noisy sample that complements the sustain sample at the bottom (1). This way the middle position is the default, with the user moving the control up to get a more percussive sound, and moving the control downwards to roughen up the sustain sound with noise.
There is a catch, of course. Having a single control for sustain and percussive sounds means that we can adjust the mix between them, but not the overall volume. Of course, if those are the only sounds that we are using then an Expression pedal or control could be used to alter the overall volume. But if we wanted to control the balance between two pairs of sustain/percussive sounds, then expanding things out to 4 separate volume controls is probably the best option. As someone who is notorious for having complex user interfaces (UIs), then please forgive me when I try to explore other, more 'compact' options. Maybe there is a case for doing different UIs for different end uses...
Finally, before thinking about the next level, consider current high-end stage pianos - Nord Stage 3, Yamaha CP88, Roland RD-2000 et al. The reason they have lots of controls is because of the complexity of balancing piano with strings, pads, etc. in a modern 'gigging' context. Then think back 70 years and consider the controls on a (Fender-)Rhodes Mark 1 Stage Piano - only two rotary controls and effectively only one (very expressive) sound (although if you added an MXR Phase 90...). Times have changed!
Further extensions
The samples need not be conventional samples, they could also be release samples triggered by 'Note Off' MIDI messages, or even one of those large pools of legato samples.
Now that I have shown you the way to move from two samples to three, you have probably realised that this can be extended to as many samples as you want, although don't forget that squashing too many samples onto a small rotary or linear control might overwhelm the end user! (It also gets harder to choose an ordering of samples that makes the limited number of available fades feel like they are the right ones, and you don't get users asking how they fade between samples in different parts of the control...)
Once you have got your head around Translation Tables, then you can do a lot with them. I have just been scratching the surface in this blog post...
The important thing is that Translation Tables are one way to achieve sophisticated user control over multiple samples, without a huge amount of complexity being required 'behind the scenes'. Anything that makes creating Decent Sampler virtual instruments easier is good in my book, and I hope that this blog post has opened up some new possibilities for your Decent Sampler programming!
The Arbitrary Curve spreadsheet
So, now that you know why translation tables are useful when controlling volume (and other parameters) in Decent Sampler, you probably want to know if there are any useful utilities to help you make them. That would be my companion to 'Power_curve', the mysteriously-named 'Arbitrary_curve'.
 |
| The 'Arbitrary_curve' spreadsheet... |
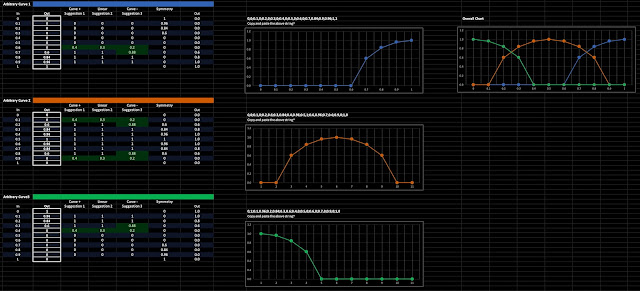
This time there are three sections, which are combined into an overview on the far right hand side. The curves shown are minor variations of the ones shown above, but with a higher degree of resolution - the previous curves were hand coded, whereas Arbitrary_curve makes it much easier to use eleven 0.1 resolution tables, which I wouldn't recommend attempting by hand.
translationTable="0,1;0.33,0.66;0.5;0,0.66,0.0 ;1,0"
translationTable="0,0;0.33,0.66;0.5,1;0.66,0.66;1,0"
translationTable="0,0;0.0 ,0.0 ;0.5,0;0.66,0.66;1,1"
The above is the hand coded, low resolution, linear-approximation version from earlier. Copying and pasting the three tables from the Arbitrary_curve spreadsheet gives this result:
translationTable="0,0;0.1,0;0.2,0;0.3,0;0.4,0;0.5,0;0.6,0;0.7,0.84;0.9,0.96;1,1"
translationTable="0,0;0.1,0;0.2,0.6;0.3,0.84;0.4,0.96;0.5,1;0.6,0.96;0.7,0.6;0.9,0;1,0"
translationTable="0,1;0.1,0.96;0.2,0.84;0.3,0.6;0.4,0;0.5,0;0.6,0;0.7,0;0.9,0;1,0"
As you can see, we have entered the arcane topic of 'obfuscation', the art of hiding things in plain sight. Via detail in this case. Your mind can cope with visualising about five points, but 11 is just too much of a stretch for most people, and the format: pairs of numbers separated by semi-colons, doesn't help. Now if we reformat the pairs:
0, 1
0.1, 0.96
0.2, 0.84
0.3, 0.6
0.4, 0
0.5, 0
0.6, 0
0.7, 0
0.9, 0
1, 0
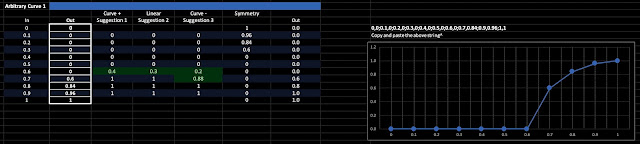
Then it is easier to read, and this is how you enter points into Arbitrary_curve.
 |
| One of the three 'Arbitrary' tables... |
This time, there are eleven boxes to fill in. Notice that the 0, 0.1,...0.9, 1 values are fixed, so the input is always between 0 and 1. All you need to do is specify the outputs for each input. From the box, across the the right, are some automated assistance 'suggestions' which may help you to make neater curves. The 'Curve+' suggestion1 column will suggest values to enter in to box on the same row by highlighting numbers in green. if you use these then you will get curves much like the power law-ish ones shown. The next column is 'Linear', and these suggestions will just give you straight lines instead of curves. The next column is 'Curve-', and this suggests numbers that will give log-ish curves. The maths behind these numbers is not sophisticated, and it doesn't work very well at the edges, but it can be useful. In these days of everything being available as a YouTube tutorial, then I'm expecting someone to do one!
The 'Symmetry' column is for Asperger's Syndrome or OCD people, and reverses the list of points so that you can see what to enter to derive combined tables. So I tend to fill in curve 1 and 3 first, then enter the relevant values into curve 2, and so then the symmetry column shows you if you are copying across correctly.
Spreadsheets are intended for being used by people who like playing with numbers, and often only their creator, so don't expect to be able to use Arbitrary_curve instantly or easily. It may take you a while to get your head around how it works (Power_curve is similar, but it is simpler, and so there's less risk of being overwhelmed!). The basic 'learn as you go' technique is to try making a table on Power_curve, paste it into a table in Decent Sampler, and listen to what it does. Then tweak it, paste again, and listen again. It is a tried and tested method of software development, trust me. Using utility spreadsheets makes it easier to see what you are doing, but the 'copying, pasting, evaluating, adjusting' loop is old and it works.
Who knows, eventually Decent Sampler may get a purpose built tool that will let you define tables with just a few clicks, and there will be no need for spreadsheets. Until then...
As it happens, I used the Arbitrary_curve spreadsheet to design the translation tables used in this Pianobook.co.uk virtual instrument:
Utilities
The 'Power_curve' spreadsheet - download
Available in .xlsx and .ods formats, this is good for designing non-linear curves for the low-pass filter cutoff frequency control, and other cases where you want specific detailed control for part of the control's range. It isn't intended for designing sophisticated Translation Tables for doing complex mixing as shown in the second half of this blog post.
The 'Arbitrary_curve' spreadsheet - download
This is also available in .xlsx and .ods formats, and is designed for creating the detailed control curves for volume, etc. This doesn't mean it is amazingly sophisticated - you will have to enter numbers into the boxes, but there are 'automated assistance' suggestions that may make it easier to figure out what those numbers should be...
---
If you find my writing helpful, informative or entertaining, then please consider visiting this link:

(Encourage me via a different route entirely...)
Or just tell someone else that there's this amazing blog about hi-tech music...







 Buy me a coffee (Encourage me to write more posts like this one!)... or...




 Posts
Posts

